Charts Module allows you to show charts directly on your monitors!
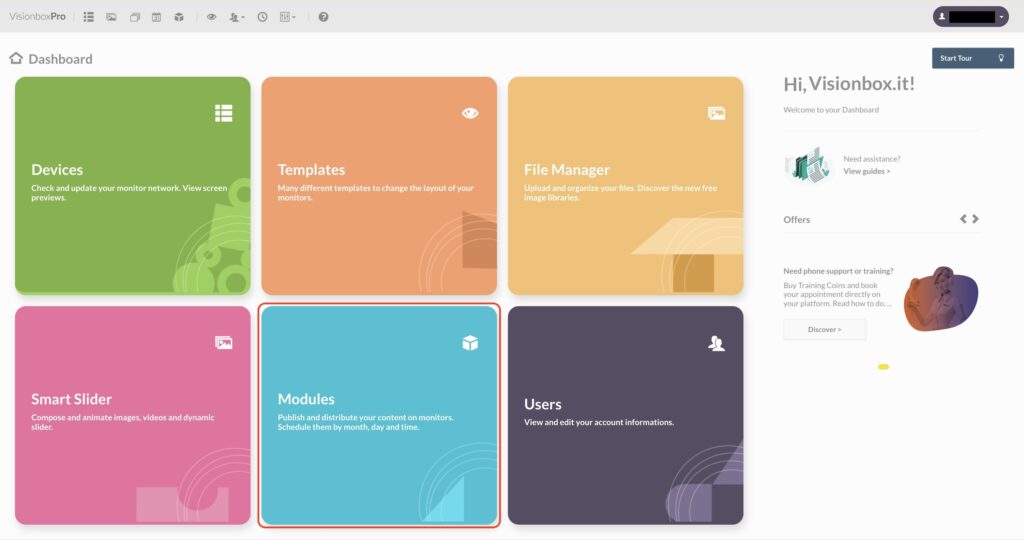
Access the Module Panel from Dashboard.
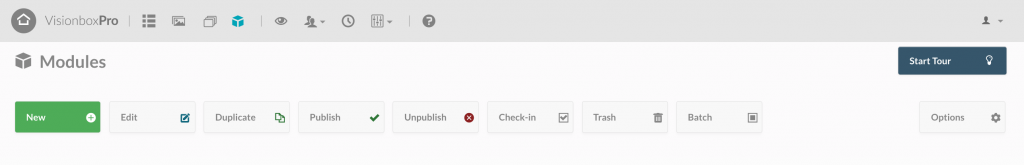
In the toolbar, click on New.
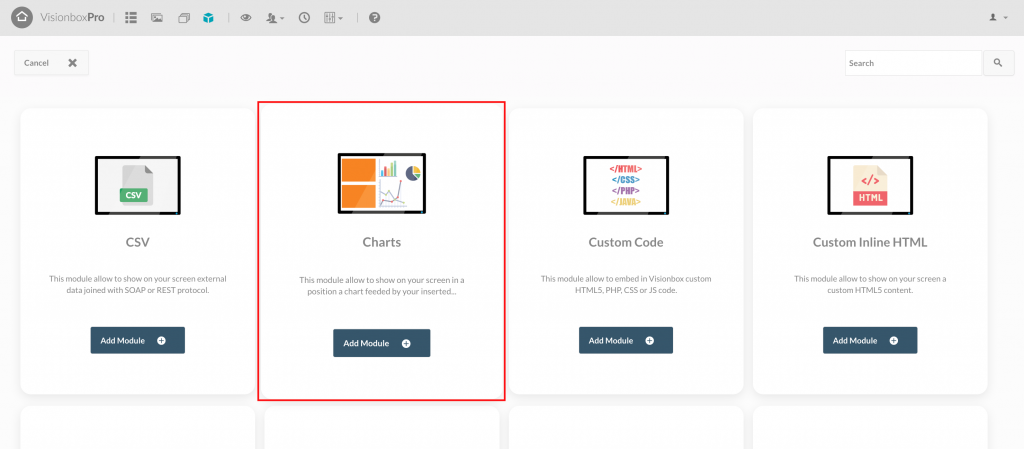
Select the Charts Module.
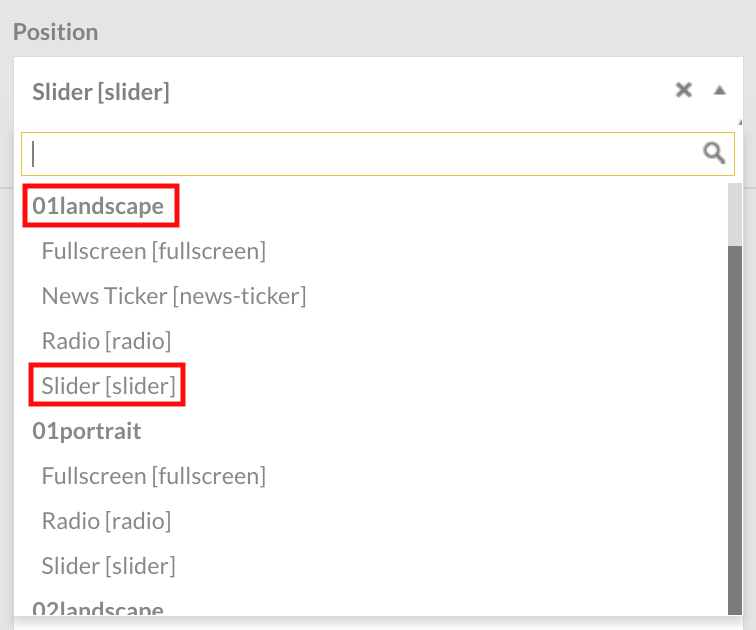
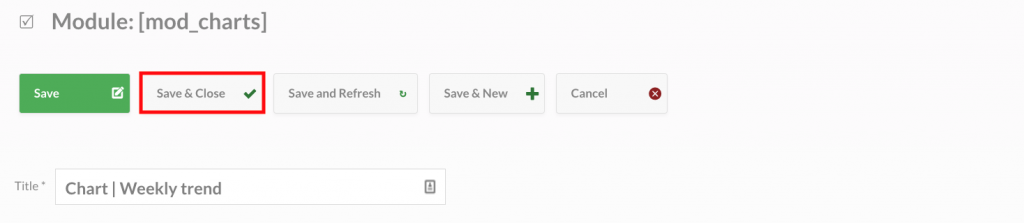
Click inside the Module and choose the Title (1). Make sure it’s a title that lets you quickly understand what you are viewing (for example, Chart | Weekly trend). Select the Position (2) from the dropdown window on the right. Then, click on Save (3) to apply changes.
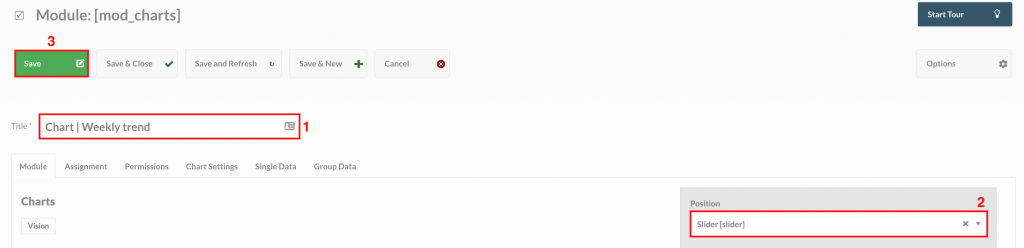
Tip: Clicking on Position a drop-down menu appears. Here you will find all the Templates and the related positions. Templates are highlighted in bold. Choose the position of the Template you used to show the chart inside your broadcast.
Move on to the Module configuration. Let’s start clicking on Chart Settings.
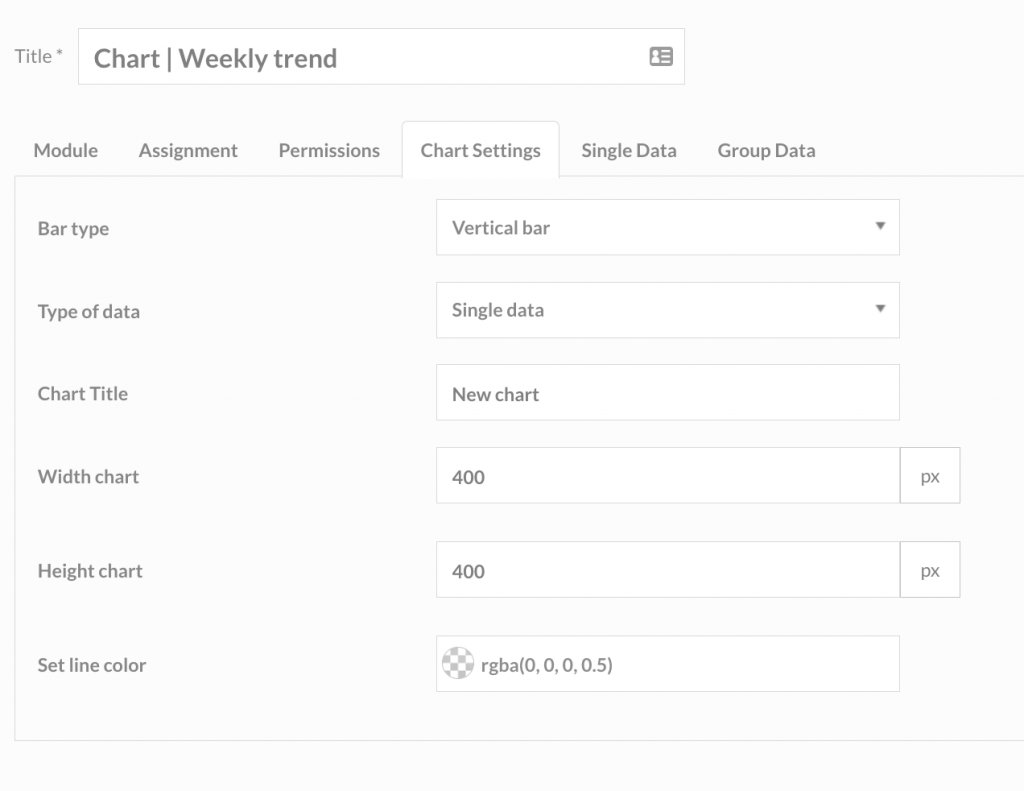
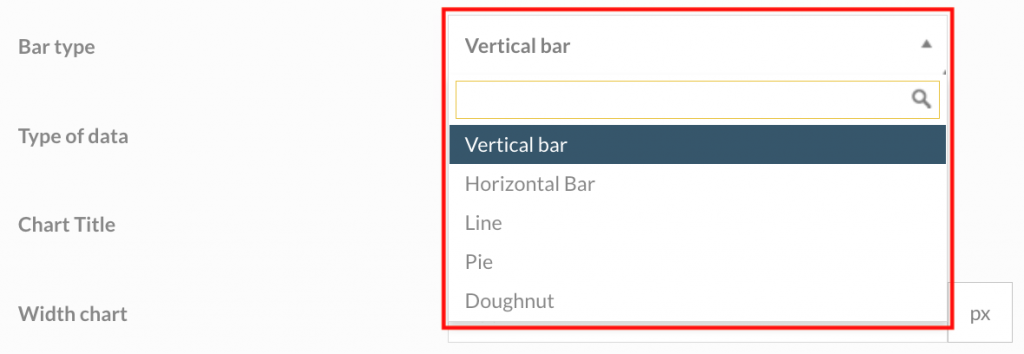
From the Bar Type field, you can choose the type of chart. Vertical, horizontal, line charts, pie and doughnut charts.
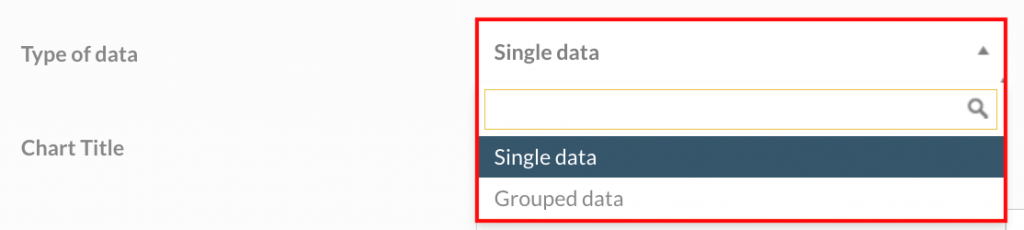
From Type of data field you can set up single data or grouped data. Move on to the corresponding tab to start adding your data.
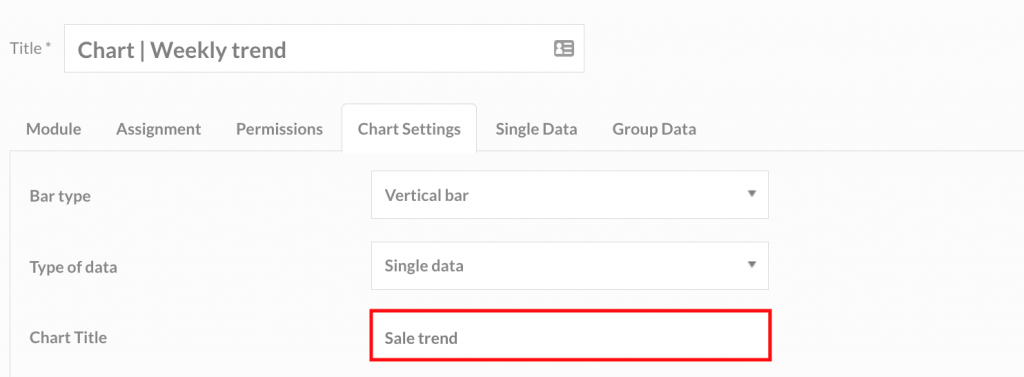
From Chart Title field you can set the title that will be shown on the screen..
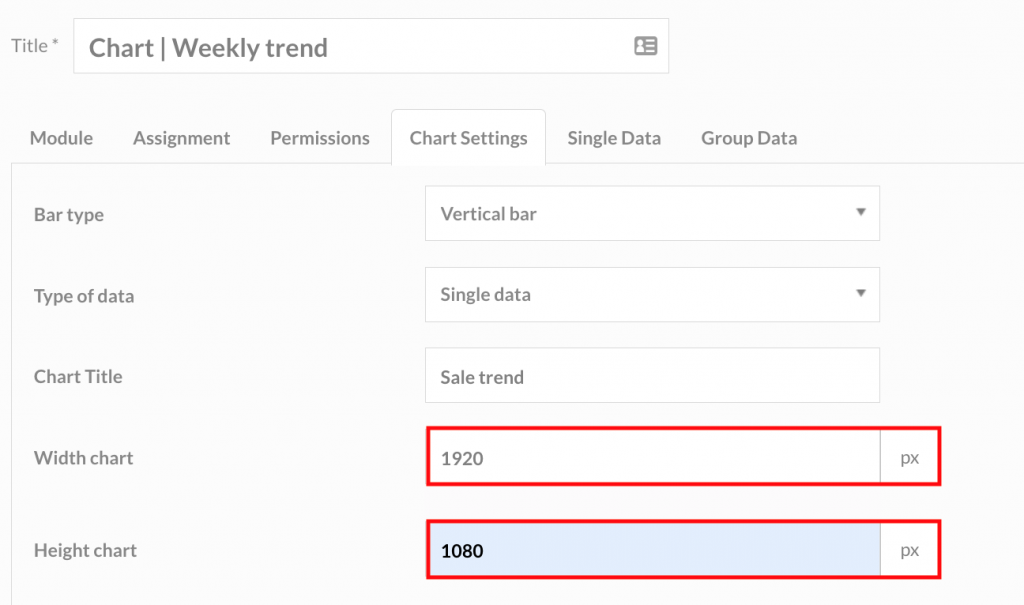
From Width and Height Chart field you can set the dimensions related to the position of the Template you use.
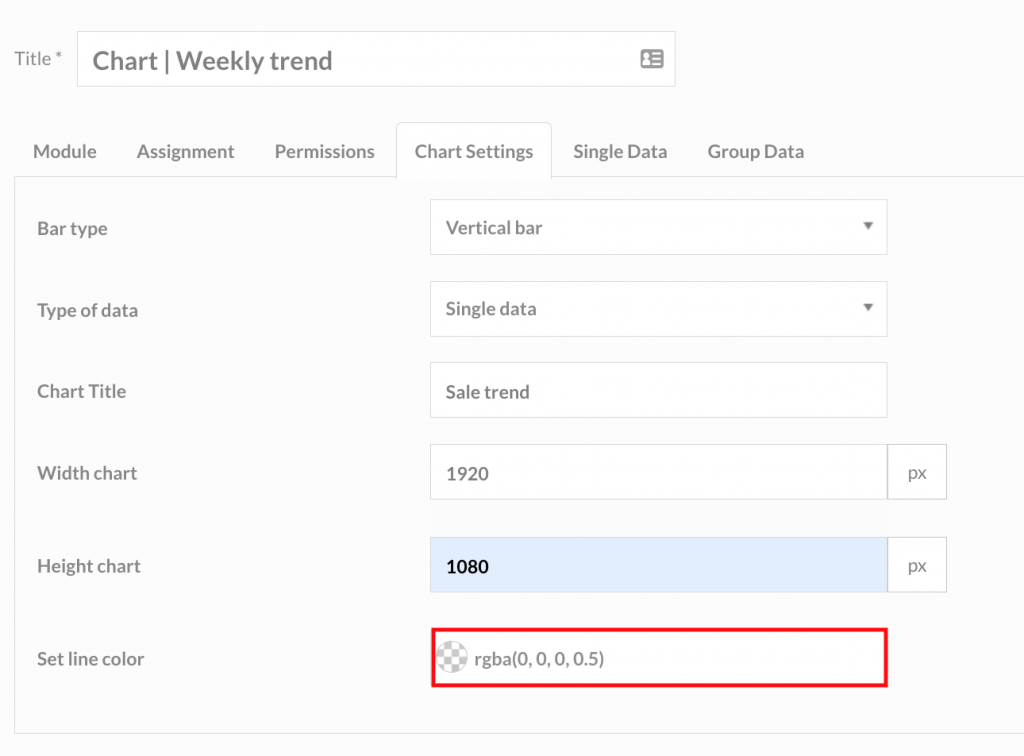
From Set line color field you can setup the lines and borders color of your chart.
Single Data
From Single Data tab you can insert the charts data differentiating them individually.
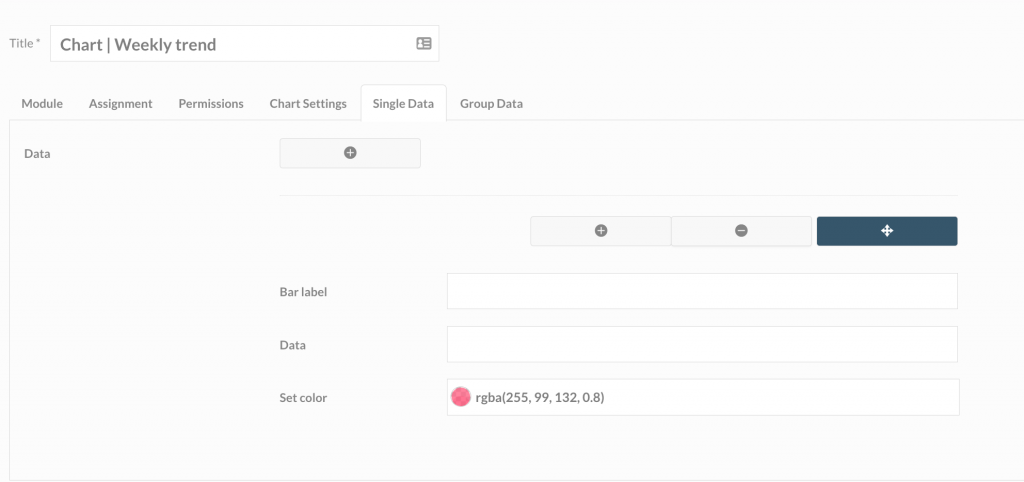
Click on + button to start adding your data.
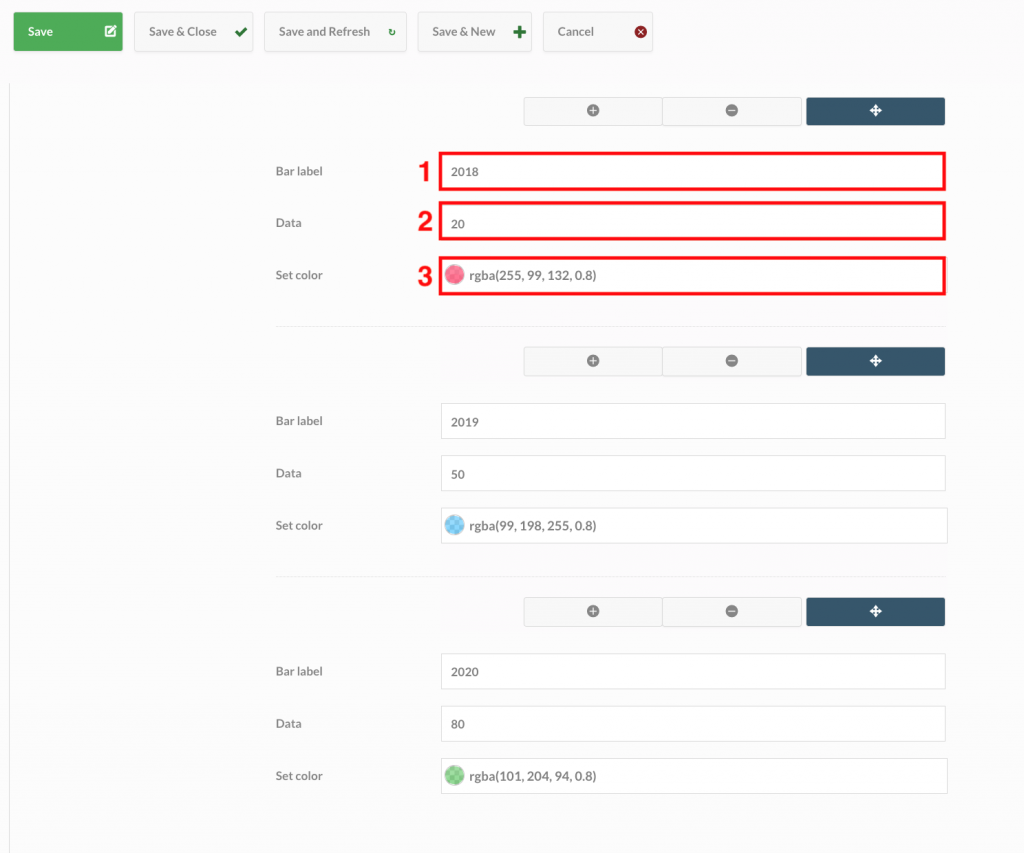
From the Bar Label field you can set the label on the x-axis (1). From the Data field insert the value of the bar label that will be shown on the y-axis (2).
At last, set up a color from Set color field to differentiate datas (3).
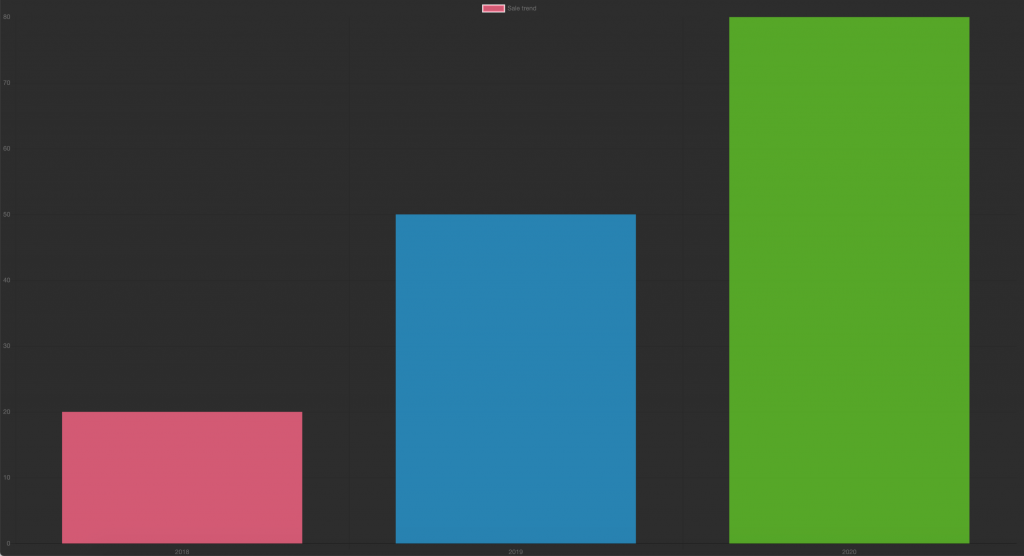
Final result will be:
Tip: to complete the Module Charts configuration, you must assign the Module to the interested Device (Schedule and Assign the Module to the Device).
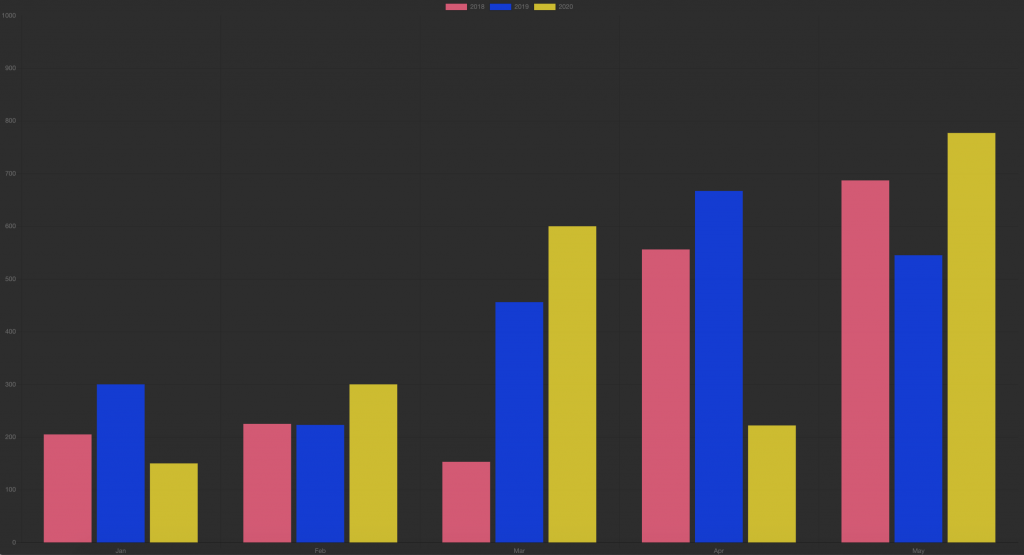
Grouped Data
From Grouped Data tab you have the chance to use data in a grouped way.
Tip: make sure that the Chart labels quantity (1) is the same as the amount of data inserted (2).
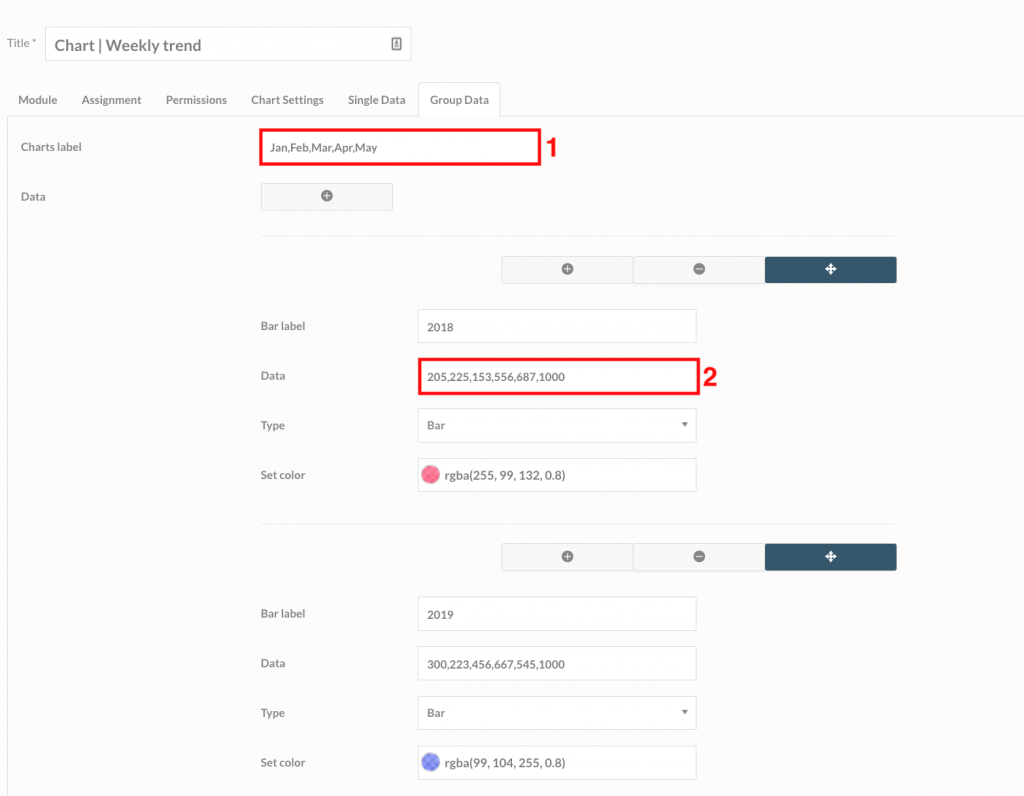
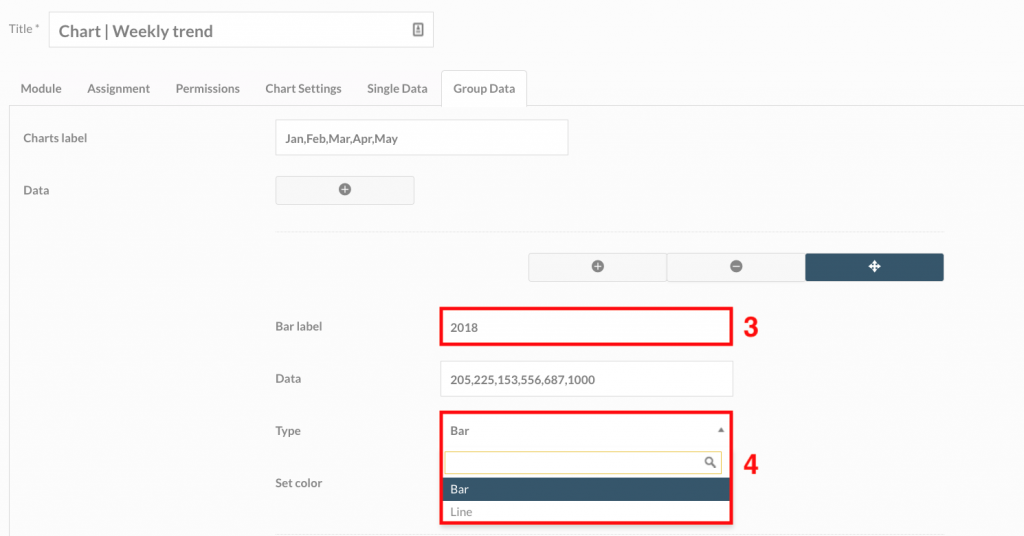
From Bar label field you can set up a label on the x-axis (3).
From Type field you can select the chart type: bar or line (4).
At last, set up chart color from Set color field to differentiate data (5).
Final result of you chart will be:
Once all datas has been inserted, click on Save and Close to apply changes.
Once the Module has been assigned, wait for the automatic updates set in the early morning or perform a manual update (Manual refresh of Devices) if you want to update immediately your broadcast.